Monitoring is a word that gets used loosely in the lighting industry. It sometimes means "I can see my fixtures in the console." Sometimes it means "I opened Wireshark for ten minutes during setup." And sometimes it just means someone walked the rig with a coffee and squinted at the truss.
None of those are monitoring. They're spot checks.
Lighting network monitoring means continuous, automated visibility into the devices on your network. Which fixtures are online and responding. What their internal sensors are reporting. Whether their configuration has changed since the last time anyone looked. Not once during load-in, all the time.
Where the Data Comes From
The useful thing about modern lighting protocols is that they already generate the data you'd need for meaningful monitoring.
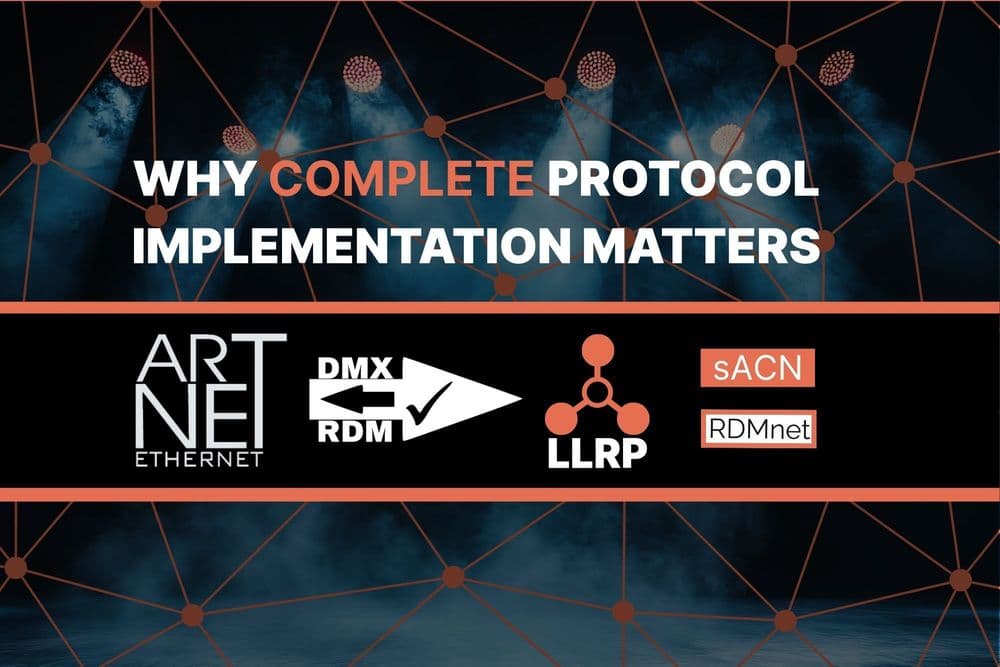
RDM, standardized as ANSI E1.20, lets fixtures report sensor values back to a controller. Temperature, operating hours, device status, error flags. It's been part of the spec since 2006, though adoption has been slow because most workflows never ask for the data.
Art-Net uses ArtPoll to announce device presence on the network. Every node periodically broadcasts its existence, capabilities, and configuration. This is how discovery tools know what's connected and it's also how monitoring tools can track what drops off.
LLRP (Low Level Recovery Protocol), part of the RDMnet standard, makes IP subnet issues a thing of the past. It discovers devices that have incorrect IP configurations, fixtures on the wrong subnet that normal discovery can't reach. For installations where equipment moves between networks regularly, this is the difference between finding a lost device in seconds by having active monitoring and spending an hour with a manufacturer's proprietary setup tool.
What Monitoring Isn't
Monitoring is not the same as troubleshooting. Troubleshooting starts when a problem has already surfaced: A dead fixture during soundcheck, a node that won't respond, a universe that's outputting the wrong data. It's reactive by definition.
Monitoring catches the signals that precede those failures. A fixture whose internal temperature has been climbing over three consecutive show days isn't broken yet, but it's heading there. A node with intermittent dropout events isn't dead, but it's warning you. A DMX address that changed overnight might mean someone touched the fixture or it might mean a firmware issue caused a factory reset.
The difference is timing. Troubleshooting happens under pressure, usually during setup or between cues. Monitoring happens continuously, in the background, with time to respond deliberately instead of reactively.
Why It Matters Now
Lighting networks have grown more complex faster than the tools to manage them. A mid-size venue might run Art-Net, RDM, and sACN simultaneously across fixtures from five or six different manufacturers. A touring rig reconfigures its entire network at every stop. The number of devices and protocols on a typical installation has outpaced the ability to manage them with manual checks and manufacturer-specific software.
Monitoring closes that gap. Not by adding complexity, but by making the status of the entire network visible in one place.
Get Started
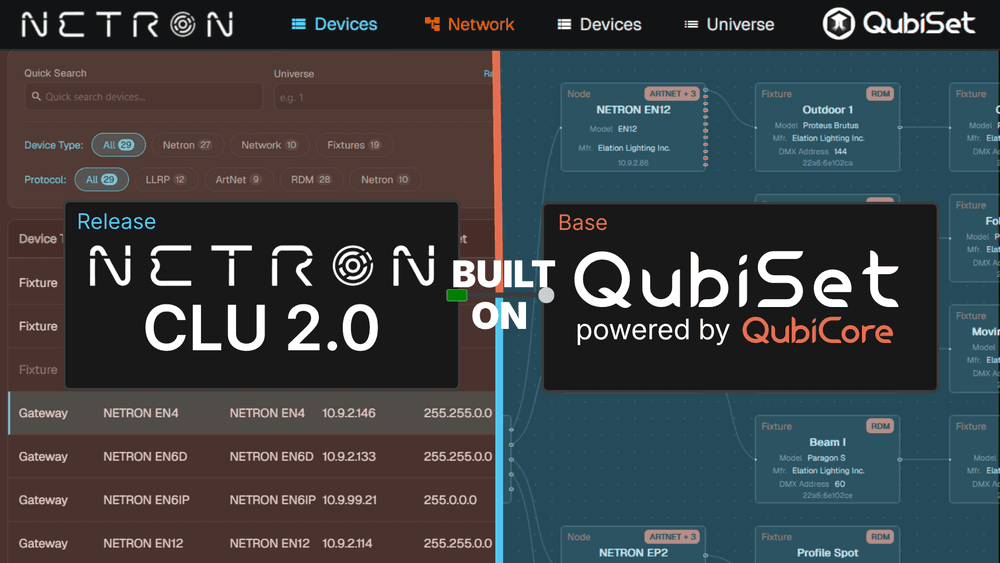
QubiSet is built for exactly this. Real-time device discovery, live status monitoring, and configuration management across Art-Net, RDM, and LLRP, all in one interface. If you've been managing your lighting network with a mix of manufacturer tools and manual checks, this is a good place to start.
- Download QubiSet at qubicast.com/qubiset
- Enter your beta access code during installation
- Connect to your lighting network and let QubiSet discover what's there
No access code yet? Request one here and we'll get you set up.