
Dashboards
How do I build a monitoring dashboard in QubiSet?
Open Dashboards, press "Add widget", pick a widget type such as DMX Viewer, Sensor Timeline or Device Group Status, and arrange the widgets with "Edit Dashboard".
Plan: Free shows the starter dashboard. Editing and your own dashboards need Freelance or higher.
Short answer
Dashboards, "Add widget", choose a type, fill in its settings, "Add widget". Use "Edit Dashboard" to move and resize.
What this is for
A dashboard is a page of widgets that shows the state of your rig at a glance: live DMX of a universe, a temperature curve, how many devices of a group are online, which alert rules are triggered. Put it on a screen in the control room or check it before doors open.
Before you start
- Plan: on Free you see the starter dashboard but cannot change it. Adding widgets, editing and more dashboards need Freelance or higher.
- A Rig is open.
Steps
-
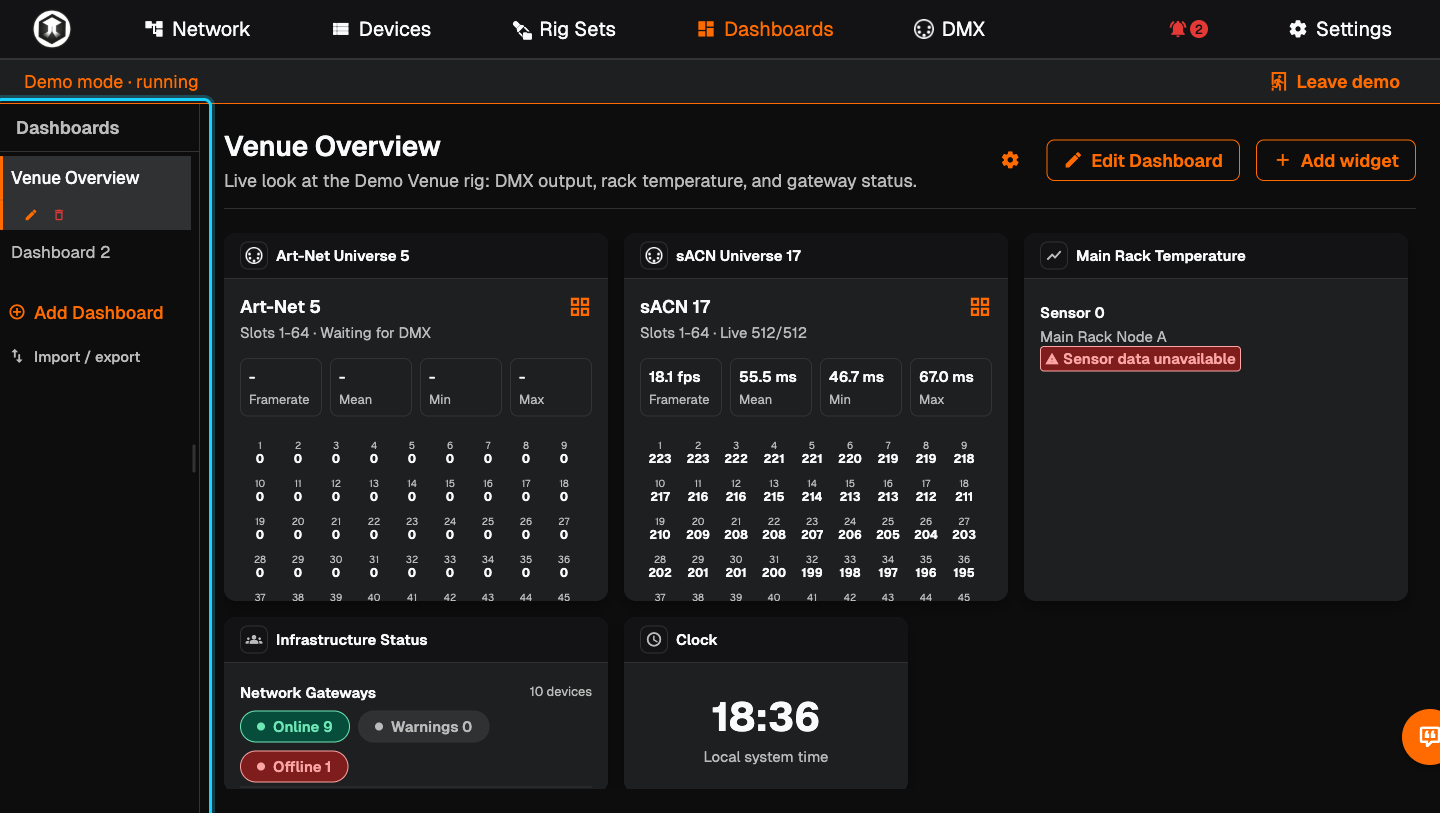
Open Dashboards. The sidebar lists your dashboards. The selected one fills the page.
-
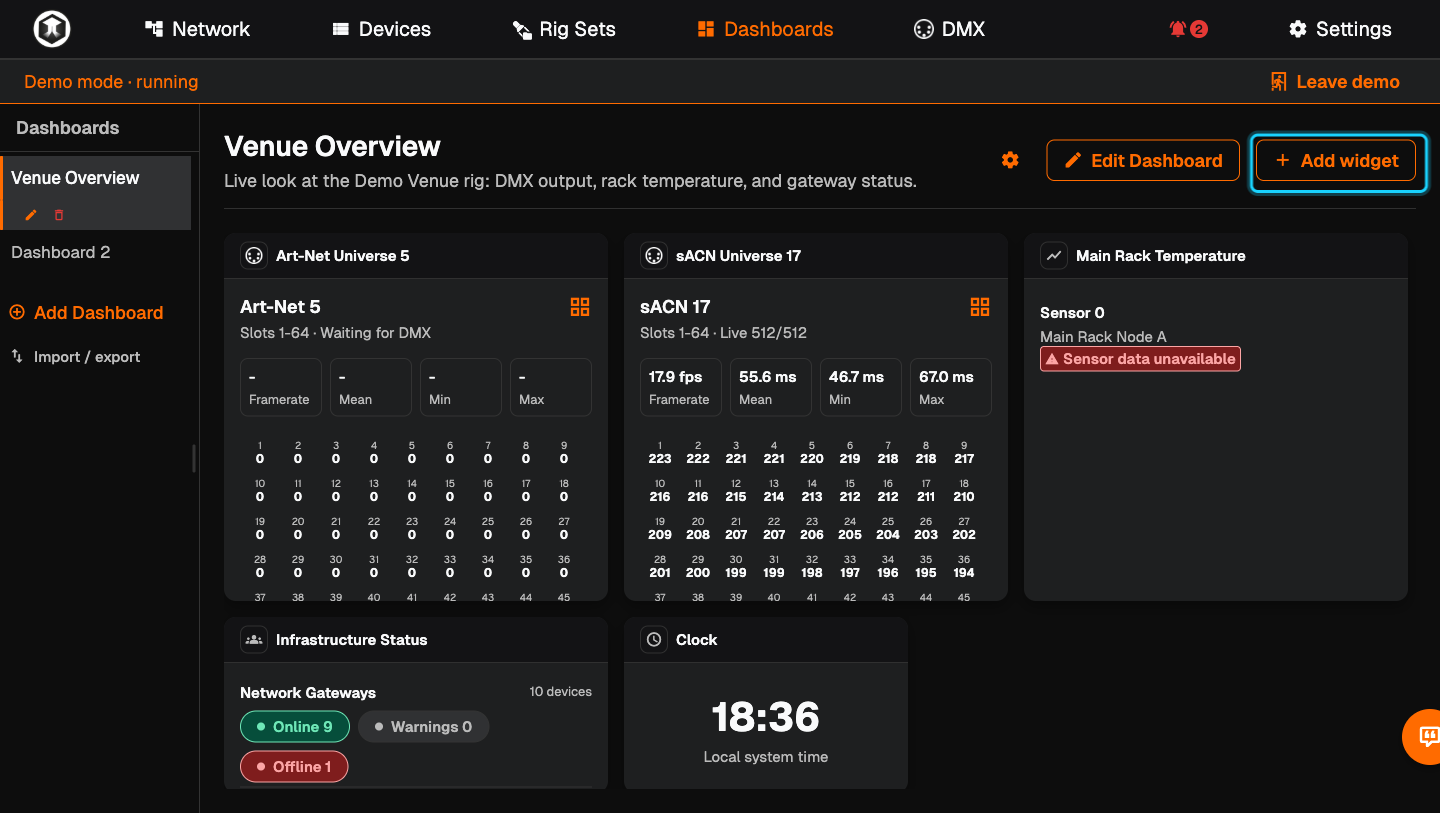
Add a widget. Press "Add widget". "Select a widget type" groups the choices:
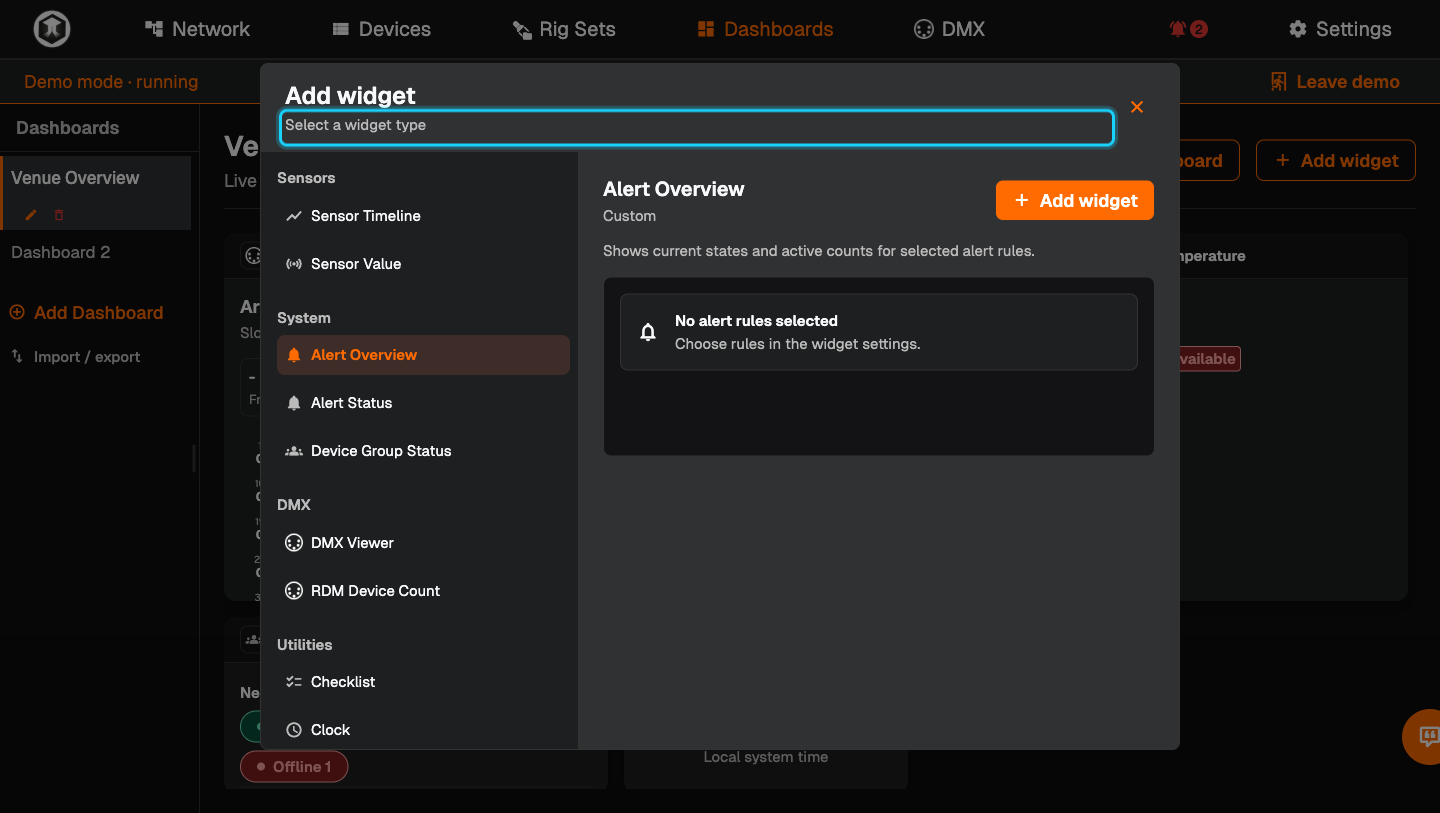
- Sensors: "Sensor Timeline", "Sensor Value"
- System: "Alert Overview", "Alert Status", "Device Group Status"
- DMX: "DMX Viewer", "RDM Device Count"
- Utilities: "Checklist", "Clock", "Countdown"
- Content & Actions: "Image", "Quick Links", "Text"
-
Choose and configure. Click a type to see what it does, press "Add widget", fill in its settings (for example which sensor or which universe) and press "Add widget" again.
-
Arrange. Press "Edit Dashboard". Drag widgets to move them and pull their edges to resize. Press "Done" to keep the layout or "Cancel" to drop it.
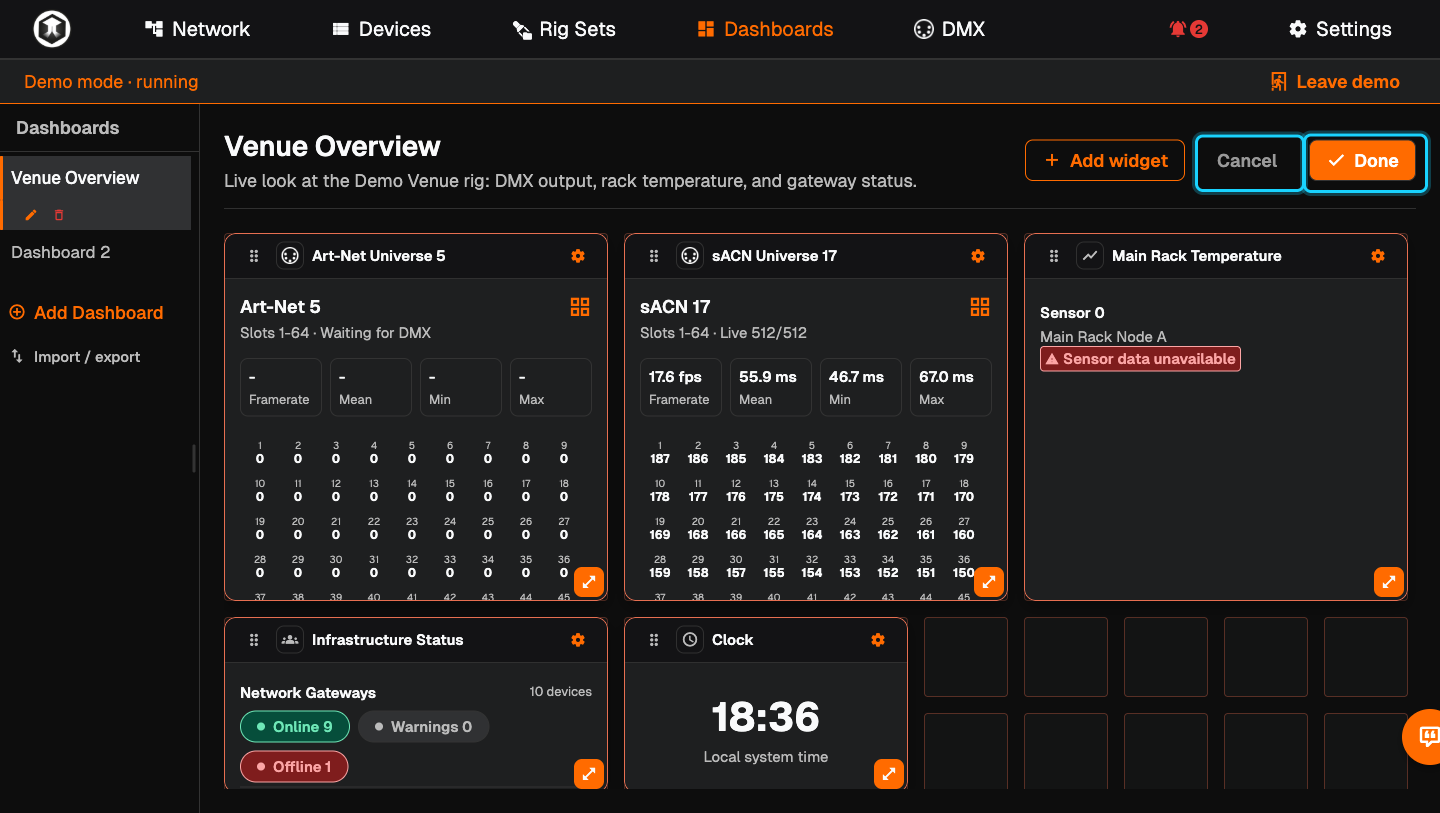
-
Add another dashboard. Press "Add Dashboard" in the sidebar. A new, empty dashboard is created at once. The pencil under its name renames it, the bin deletes it.
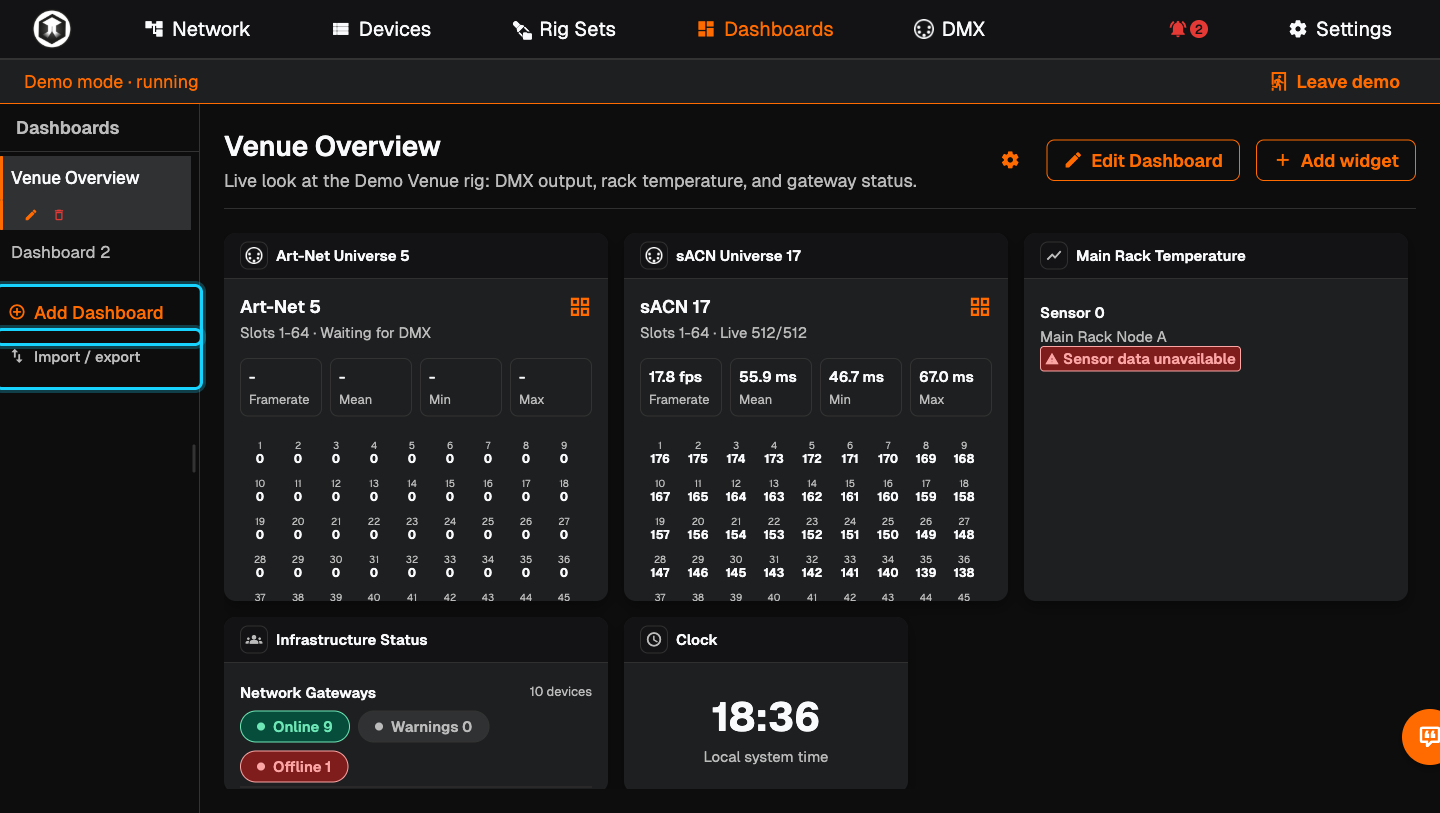
-
Back up or move dashboards. Press "Import / export". "Download backup" saves every dashboard and widget to a file. "Choose JSON file" loads such a file into this Rig.
If something is not as expected
- "Sensor data unavailable". The device has not reported that sensor yet, or sensor polling is set to "On demand". Open the device's "Sensors" page once, or change "Sensor polling" in Settings, Network.
- "No alert rules selected". Open the widget's settings and choose the rules it should show.
- A DMX widget shows nothing. Nothing is sending on that universe. Check it on the DMX page.
- "Edit Dashboard" is locked. Your plan does not include editing.
Related guides
Still stuck?
Ask us on Discord or write to support@qubicast.com. Tell us what you did and what you saw, and we will help.